Gerrymandering
Every state is required by the Constitution to redraw its Congressional districts every ten years, when the new Census data is released. State legislative districts must also be redrawn on a regular basis. In some states, the districts are mapped out by the legislators themselves; in others, they’re drawn by an independent commission. These districts determine which voters are able to vote in any particular race.
When the state legislature is controlled by a single party, the redistricting process can become a partisan endeavor. We call the act of drawing political boundary lines with an ulterior motive “gerrymandering.” While it comes in many flavors, we’ll focus on partisan gerrymandering, where one political party draws voting districts to give itself an unfair advantage. The party in power can do this in two ways: packing, where they stuff their opponents into a few unbalanced districts, and cracking, where they disperse their opponents into several districts so they’re always a minority. A combination of packing and cracking can significantly reduce the opponent’s seat share relative to their total vote share, as in the example below.
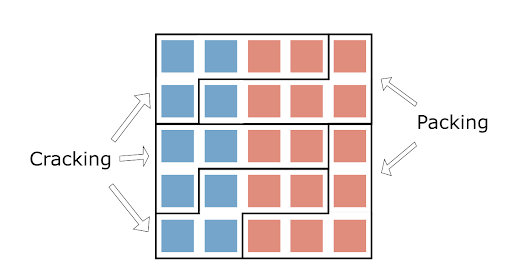
Although reds outnumber the blues, the blues still win an extra district in the rightmost plan. The districts won by the reds are an example of packing: there are four red and one blue node in each — more red voters than are actually required to win. Conversely, the other three districts have only three blue voters each, which is the bare minimum number needed to win. By cramming the reds into those two districts on the right and denying them a majority in the three leftmost districts, the blues have effectively packed and cracked here.
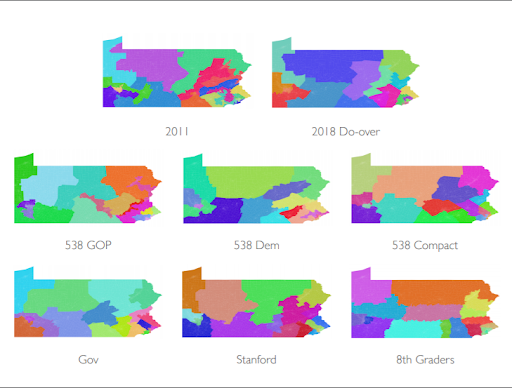
Now, here are a few districting plans for Pennsylvania. Which ones do you think are gerrymandered? Which are not?
Why should you care about gerrymandering? In a representative democracy, your vote is your voice — but if your vote has been packed or cracked, your voice won’t be heard as strongly.
Detecting gerrymandering
Sometimes gerrymandered districts look fishy; sometimes they don’t. We need a more precise way than just using our eyes to tell when there’s been gerrymandering. Many political scientists, mathematicians, and lawyers have created formulas that claim to do exactly that. These metrics give you a number based on the districting plan of a certain state and the election outcome.
One common metric is “mean-median,” which tells you how many votes a party needs to win at least half the seats. Another popular metric is called the “efficiency gap.” This measures the difference between the wasted votes for each party.
Both of these metrics have major disadvantages, but they can help us understand the idea of outlier analysis. For this example, let’s stick to thinking about Mean-Median.
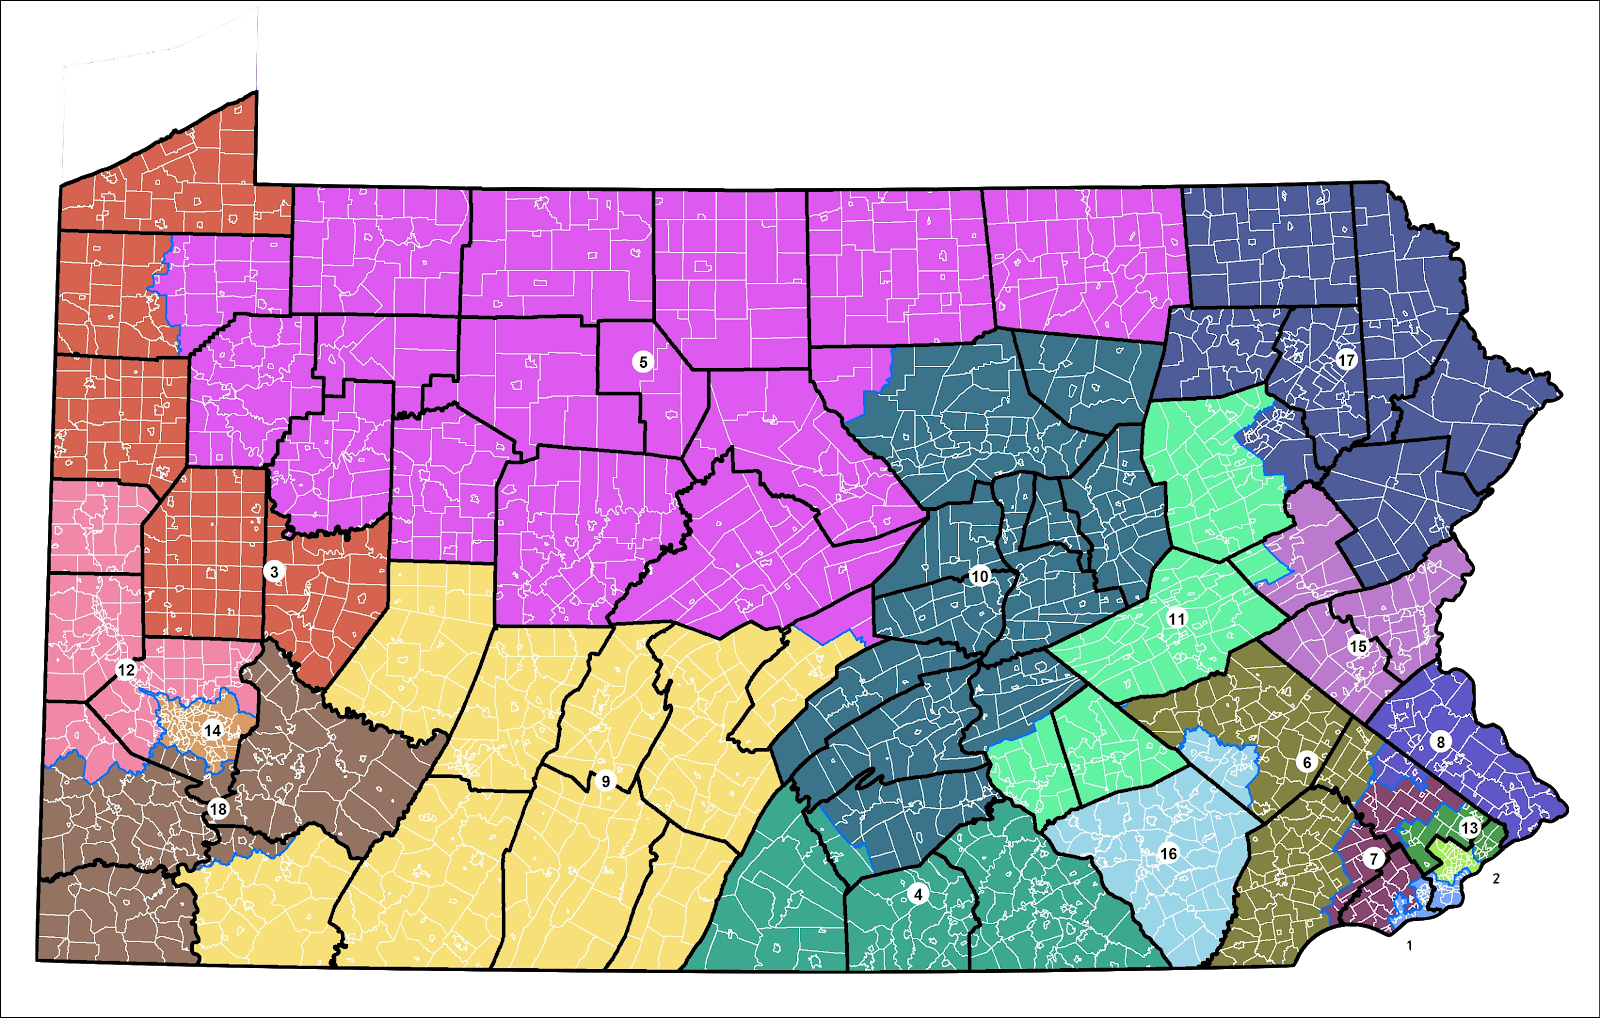
The Mean-Median score for the above districting plan for Pennsylvania’s 2016 Senate race is -0.046. Does this number seem big or small to you? Would you conclude this plan was gerrymandered?
It’s actually not possible to conclusively detect gerrymandering from only one number! What else would you need to know to answer?
Distribution of Human Heights
To figure that out, let’s take a step back from Mean-Median and think about another situation. Picture this: late one afternoon, an old friend texts you out of the blue and says they’ll tell you how tall they are. You remember their parents were of average height, and you assume they are too: 5’ 7”, maybe.
The answer they actually give you? 7 feet. Of course, you laugh, certain that they’re lying to you.
But why are you so sure? For one thing, you probably don’t know anyone who is 7 feet tall. You might have a few friends who are over 6 feet tall, but most of the people you’ve met are somewhere between 5 and 6 feet tall. If you were to plot how many people you know at each height, the picture (called a histogram) would look something like this:

When your friend tells you they’re 7 feet tall, you decide they’re lying. You know this because you had context for that numerical answer. But if you didn’t know how tall most people are, you wouldn’t be able to make that determination. This is the problem with any given partisan metric: nobody has any idea which outcomes are common and which are rare for a particular state, at least not without further research.
Large numbers of plans
Just like you needed to know many people’s heights in order to understand how rare 7 feet is, you’ll need to consider many different districting plans for your state in order to understand which Mean-Median scores are most common. Consider Pennsylvania. There are actually quintillions of different ways to split Pennsylvania into 18 Congressional districts! If you can find around 10,000 of these distinct plans and be confident that they are representative of the universe of all possible plans, you can use those 10,000 maps to get a sense for the distribution of Mean-Median scores in Pennsylvania.
Rather than drawing thousands of plans by hand, you can use a computer algorithm called Markov Chain Monte Carlo (MCMC) to sample the plans and build a histogram. Try it out below!
Sampling districting plans in Pennsylvania
The MCMC algorithm discovers a variety of districting plans with a range of election outcomes.
Now you can see how your districting plan compares to other possible districting plans. This method helps you judge your gerrymandering score in the context of other ones — just like you did with your friend's height.
This type of thinking is called outlier analysis, and it works for any partisan metric, not just the Mean-Median. There’s no metric out there that can tell us with just a single number if a plan has been gerrymandered; we always need to consider these numbers in their contexts. If you find that a plan is an outlier compared to other possible plans for a given state, then you have good reason to be suspicious.
Further Questions
How much of an outlier is too much? This is tough, and there is no simple answer. Would you believe a friend who claimed to be 6 foot 6? What about 6 foot 2? Outlier analysis can’t always tell you which plans are actually gerrymandered. Take the example below: is the plan with a Mean-Median score of -0.15, represented by the red line, an outlier? What about a score of -0.065, shown by the green line?

Now that you have a sense of the distribution of Mean-Median scores, can you use it to provide context for a districting plan in any state, for any election? Unfortunately, no. The political landscape of each state is different, and changes from election to election. In order to understand what a given metric is telling you, you have to run MCMC sampling on each state separately, to provide the necessary state- and election-specific context.
Think of your tall friend from before. If they were an NBA player, you might be less suspicious that they claimed to be 7 feet tall, since NBA players tend to be much taller than the general population. Check out how their height distributions differ!

As an example, we see below that Virginia has a different distribution of Mean-Median scores than Pennsylvania. A Mean-Median score of -0.045 isn’t an outlier with respect to the 2016 Pennsylvania Senate race, but it would be an outlier for Virginia’s 2018 Senate race. Without looking carefully at the specifics of the state we want to analyze, we can’t use the metrics to make any meaningful claims about gerrymandering.

Exercise: North Carolina
Outlier analysis was used in two recent Supreme Court cases to argue that a particular districting plan was a partisan gerrymander. After the 2010 Census, each state redrew its boundaries to reflect the new population data, and some states took the opportunity to do some gerrymandering. The first plan North Carolina proposed was successfully challenged in court as a racial gerrymander. It then drew a remedial map, which was the subject of the Supreme Court case Rucho v. Common Cause. Voters sued the state of North Carolina, claiming that the second proposed plan gave Republicans an unfair advantage by packing and cracking Democratic voters.
If we take a look at this plan, we might expect to see a few districts with very high percentages of Democratic voters. These districts would be an example of Democratic packing. We’d also expect to see a larger number of districts that lean slightly Republican: they’d be cracking Democrats by spreading Democratic votes over several districts. We can explore this plan (which is actually the current NC Congressional plan) by using Districtr:
Explore the NC Congressional plan in Districtr.
Go to the "Evaluation" tab and take a look at “Partisan Balance.” This shows us the percentages of Democrats and Republicans in each of the 13 Congressional districts.
- How many of the 13 districts are majority Democratic? How many are majority Republican?
- Can you find any district with over 65% Republicans? What about over 65% Democrats?
North Carolina is split almost half and half between registered Republicans and registered Democrats. Does this surprise you, given your answers for the first question?
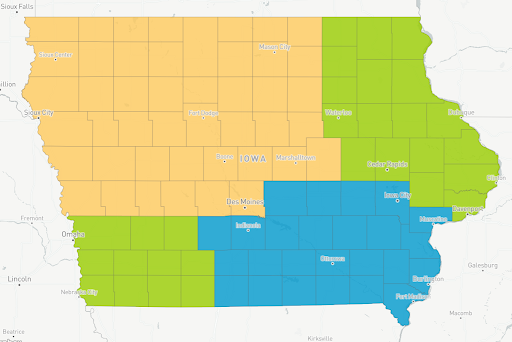
Now, let’s make some edits to the plan. Each state has rules to make sure its districting plans are reasonably “nice,” and population balance and contiguity are two of the most common. Population balance means that all districts should have roughly equal populations. Contiguity means that the districts are not split up into multiple parts that don’t touch each other. In the map for Iowa below, the yellow and blue districts are contiguous, but the green district is not.
As the NYT notes, this plan splits several major cities across two districts. Let’s put the cities into some new districts.
- What happens if you put Winston-Salem and Greensboro in the same district, and adjust the districts around them for population balance? How many districts are Democratic now?
- Take a look at the Raleigh and Durham area. What happens if you try to make the Durham district less strongly Democratic, and move some Democrats to more rural districts?
- Can you do the same for Charlotte?
What’s the highest number of Democratic districts you can make?
After you’ve gone through the above questions, you’ll have seen a wide variety of plans, with different numbers of Democratic and Republican districts in each.
- How many of your plans had only 3 Democratic districts?
- Did you see a lot of plans with more than 3 Democratic districts?
- If you had to present your findings as an expert witness to the judge, what would you say? Do you think the current plan is intended as a Republican gerrymander? (Is it an outlier?)
In Rucho v. Common Cause, the plaintiffs did a similar analysis. They generated a large number of districting plans using MCMC and then examined individual districts within those plans.